Financial overview
See income, spending and what’s left.
Financial analysis
Track what’s left after expenses, see how long savings could last, and spot what’s driving changes in spending.
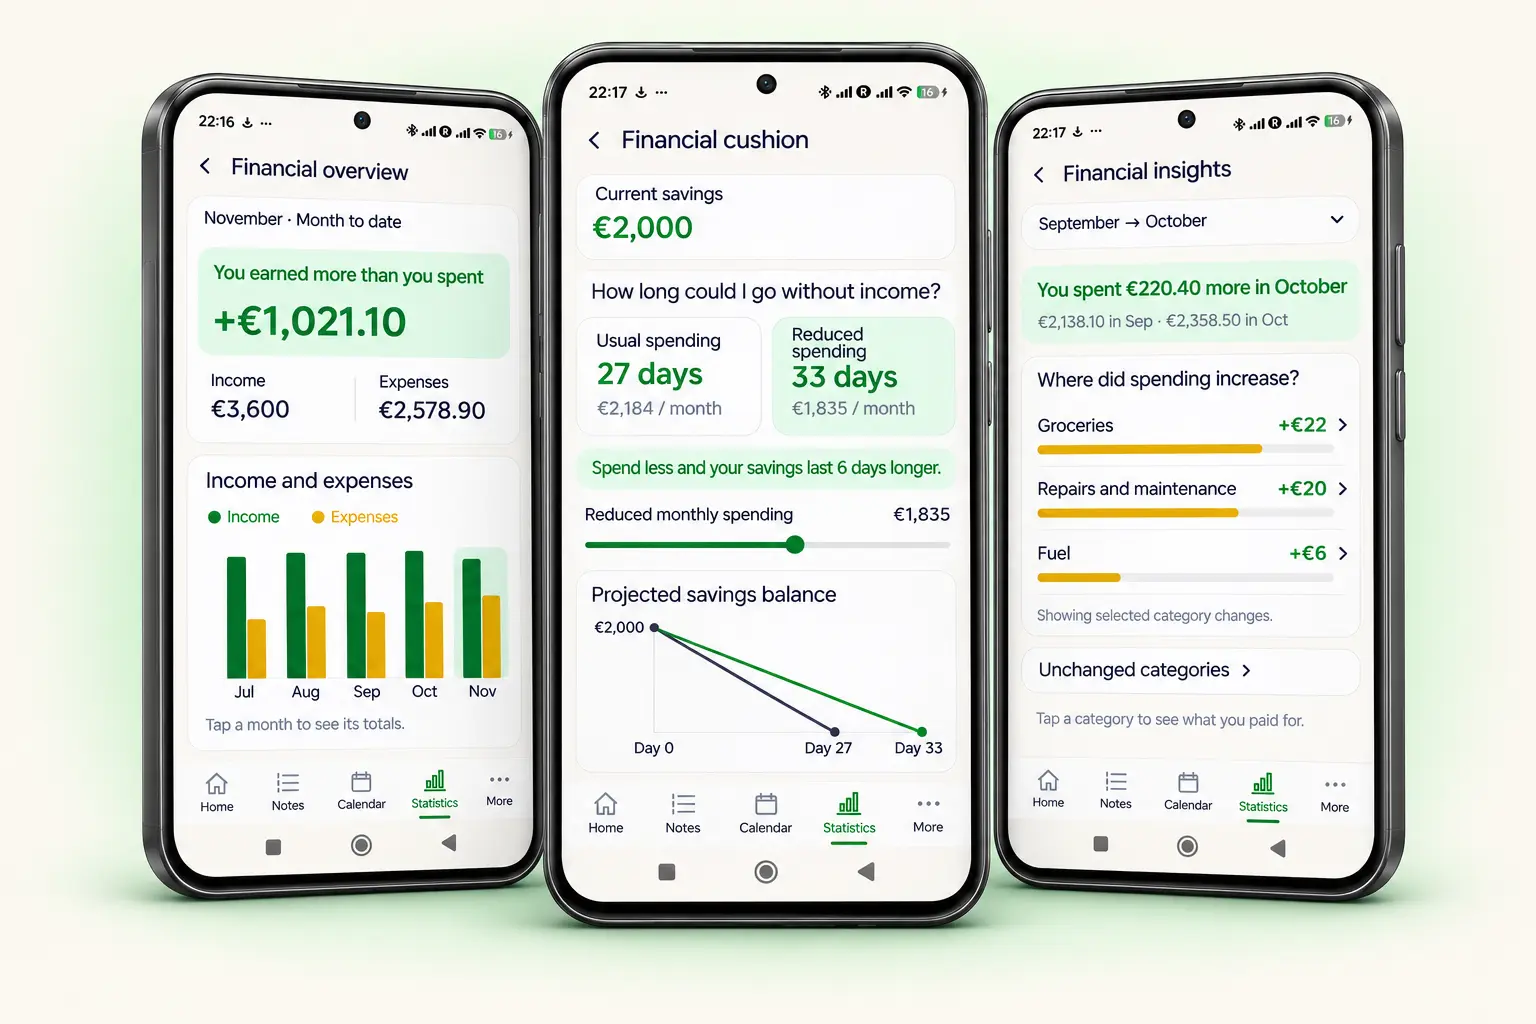
See income, spending and what’s left.
Estimate how long your savings could last without income.
Find the categories behind spending changes.
The big picture and the details
From the total to an individual entry.
Track income, expenses and balance.
The monthly view shows the selected month and the four preceding months; the yearly view shows January–December. The chart for a custom period shows up to the last 12 months.
Expenses are compared with the previous period. If the period has not yet ended, the comparison uses the corresponding elapsed days. Tap a month in the app to open its statistics.
Folder totals and their share of overall expenses.
Folders are sorted by highest spending. You can see the amount, percentage share and comparison bar. Tap a folder, then a category, to open the related entries.
The main list highlights the five largest folders or categories. The rest are grouped as “Other”, and you can expand the full list.
A month, a year or your chosen dates.
Trends and forecasts
Trends, changes and an approximate monthly forecast help you understand where your spending is heading.
The app highlights the largest expense category and the category with the biggest monetary increase. A consistent trend is identified using three full months, each with entries.
A forecast for the current month appears after at least 7 days, with expenses on at least 3 different dates. It is based on your current spending pace. This is an approximate calculation, not an AI recommendation.
Illustrative examples. The forecast appears when there is enough data.
For every folder
Separate rent or mortgage, utilities and other expenses.
Tap a category to view its entries.
The doughnut chart shows three groups: rent / mortgage, utilities and other expenses. Utility lines compare the monetary amounts of individual categories by month.
Rental income and balance are shown when received rental income is linked to the folder. In the overall statistics, the utility chart shows money, not kWh or m³.
Financial report
Summary, charts and detailed entries — easy to save or share.
The period, currency, summary, monthly bars, category doughnut chart and expense entries. It also includes recurring payments already recorded and payments still scheduled.
The overall report shows received and planned income and the balance after upcoming payments. Expected income is not included in the balance. Payments already recorded are not added to expenses a second time.
PDF preview is available in the app. Saving, sharing and printing require PRO. Insights and the utility expense line chart are not included in this PDF report.
 SpendOutline
All catalogs · November 2026 · EUR
| Date | Category | Amount |
|---|---|---|
| Nov 01 | Rent / loan | €650.00 |
| Nov 03 | Electricity | €62.00 |
| Nov 05 | Fuel | €68.00 |
| Nov 08 | Heating | €108.00 |
The SpendOutline community
What helps you every day, and what could we improve? Share your experience with SpendOutline.
User reviews